
Marketing analytics plays a central role in helping growth teams connect marketing activity to business outcomes. Data becomes valuable only when it leads to better decisions, stronger performance, and measurable impact.
Many teams face challenges not because data is missing, but because noise overwhelms clarity. Reports often produce more confusion than confidence.
Research shows that 41% of teams are not confident in analyzing their data. That lack of confidence slows down execution and increases uncertainty.
Fragmented dashboards, inconsistent definitions, and overloaded reporting create analysis paralysis.
Let us talk about it in greater detail.
Data Architecture and Tooling For Clean Analytics

Marketing data needs to be unified across ad platforms, web analytics systems, CRM and pipeline tools, social and creator channels, and customer databases.
Centralization creates a single table linking spend, pipeline, and revenue.
Tools such as Supermetrics automate the collection and centralization of signals across GA4, Meta, TikTok Ads, CRM systems, and additional sources, while advertising platform Bitmedia helps deliver targeted campaigns and generate measurable traffic that feeds into performance dashboards.
Visualization platforms such as Looker Studio and Power BI translate aggregated performance data into reports that stakeholders can act on.
Consistent tagging, shared channel definitions, and one source of truth reduce conflicts and improve measurement reliability.
Data integration platforms such as Supermetrics automate the collection and centralization of signals across:
- GA4
- Meta
- TikTok Ads
- CRM systems
Automation reduces manual work while improving consistency.
Visualization platforms such as Looker Studio and Power BI translate aggregated performance data into reports that stakeholders can act on.
Tools support execution, but tools alone cannot replace decision frameworks or disciplined measurement practice.
Foundations of Effective Marketing Analytics
Marketing analytics forms the base layer of performance clarity for growth teams.
Strong measurement allows teams to move past surface-level reporting and instead connect marketing actions to measurable business progress.
Marketing analytics involves collecting, measuring, transforming, and interpreting marketing data to improve campaign performance and return on investment.
Effective analytics provides direction for decisions about budget allocation, targeting, creative performance, and growth levers.
Clean analytics is not limited to dashboards or charts.
Strong analytics shapes decision-making by linking marketing inputs to business outputs in a way teams can trust.
Confidence comes when numbers explain results clearly and point to the next action.
Key Metrics Growth Teams Should Track
Consistent performance evaluation requires a shared set of metrics. Growth teams rely on core KPIs to judge efficiency, profitability, and scale potential.
Meaningful measurement depends on tracking indicators that connect marketing spend to customer and revenue outcomes.
Key metrics that growth teams monitor most often include:
- Conversion rate as a signal of funnel efficiency
- Customer acquisition cost (CAC) to measure paid growth sustainability
- Return on ad spend (ROAS) to assess campaign profitability
- Lifetime value (LTV) to connect acquisition to long-term revenue
- Retention to evaluate ongoing customer engagement
- Funnel engagement to locate drop-off points
- Blended metrics that tie total spend to business-level performance
Accurate attribution models also play a critical role. Attribution helps reveal where value is created across customer touchpoints.
Growth teams gain better clarity when measurement reflects the full experience instead of isolated clicks or impressions.
Building Clean Signals In Noisy Marketing Traffic

Growth teams rarely struggle due to missing data. Noise is the real challenge.
Marketing systems generate massive volumes of signals, yet only a small portion supports confident decision-making.
Clean analytics requires filtering performance data into patterns that matter.
Start With Clear Business Questions
Decision-ready analytics begins with focus. Marketing analysis should prioritize actions, not dashboards.
Growth teams benefit most when analytics begins with a specific question that can be tested.
Examples of decision-focused questions include:
- Which channels produce the highest incremental revenue?
- Which audiences show the strongest conversion efficiency over time?
- Which campaigns contribute most to long-term value, not short-term volume?
Clarity improves when analytics starts with measurable business intent.
Segment Data To Reveal Patterns
Segmentation unlocks insights hidden inside aggregate totals.
Breaking performance down by meaningful categories reveals where results are strongest and where inefficiencies appear.
Common segmentation layers include:
- Region or market differences
- Audience type and intent level
- Channel-level contribution
- Lifecycle stage performance
Growth outcomes often become visible only after separating data into meaningful groups.
Look For Patterns, Not Spikes

Short performance spikes often mislead teams into chasing noise. Sustainable growth depends on repeatable movement, not one-off bursts.
Reliable analytics focuses on:
- Trends across consistent time periods
- Stable lift across campaigns rather than isolated surges
- Repeated improvement rather than random fluctuation
Signals become trustworthy only when patterns hold over time.
Anchor Analysis Against Goals
Metrics gain meaning only when tied to targets. Growth performance should always be evaluated relative to forecasts, objectives, and planned outcomes.
Goal-aligned analytics helps answer questions such as:
- Are results tracking ahead or behind expectations?
- Which channels are exceeding efficiency benchmarks?
- Where should budgets shift based on goal performance?
Goal alignment turns numbers into directional guidance for optimization and resource decisions.
Spot And Handle Outliers
Outliers can distort performance interpretation. Anomalies may reflect tracking errors, seasonal changes, or unexpected shifts in behavior.
Processes that support cleaner signals include:
- Flagging abnormal traffic or conversion events
- Validating sudden CAC or ROAS swings
- Separating real behavioral change from data artifacts
Clean signals depend on separating meaningful shifts from measurement noise.
A Framework For Reliable Marketing Analytics
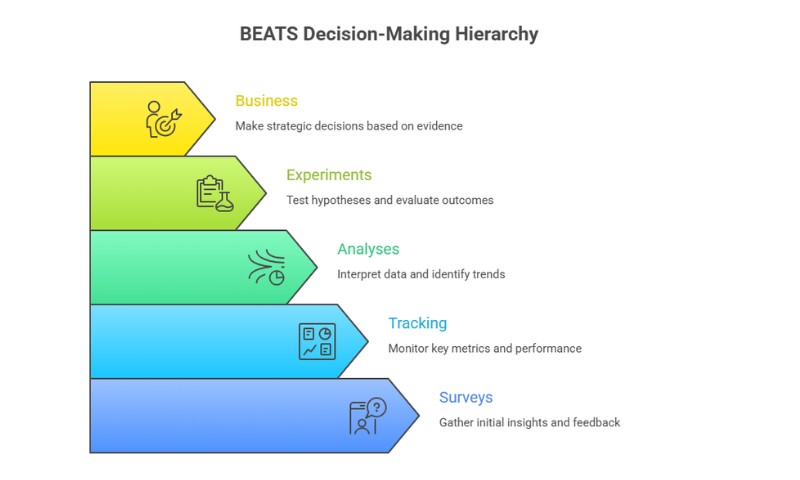
BEATS provides a strucStructured hierarchy for evidence-based decisions. Framework layers include:
- Business
- Experiments
- Analyses
- Tracking
- Surveys
Business metrics hold the highest level of decision confidence. Experiments validate causal impact. Analytical models provide planning context. Tracking metrics support tactical optimization. Surveys add qualitative feedback when quantitative data conflicts.
BEATS helps teams prioritize the most trustworthy signal depending on the type of decision being made.
Applying BEATS In Growth Analytics
Growth teams operate in environments filled with competing signals.
Paid media data, funnel metrics, attribution reports, and customer feedback often point in different directions.
BEATS helps bring structure to that complexity by ranking evidence based on decision confidence.
Growth analytics becomes more reliable when teams know which signals deserve the most trust depending on the question being answered.
Business
Business metrics sit at the highest level of the framework. Revenue, profit and loss, and contribution margin serve as the clearest indicators of overall marketing effectiveness.
Performance at this layer defines success because growth must ultimately support financial outcomes.
Decisions tied to scaling spend or entering new channels should always connect back to these top-level measures.
Key business-level indicators often include:
- Revenue growth tied to marketing investment
- Contribution margin after acquisition and fulfillment costs
- Pipeline or sales impact connected to campaign activity
Experiments
Experiments form the next layer because they provide the strongest proof of causal marketing impact.
Incrementality testing and A/B testing move teams away from assumptions and toward validated lift.
Confidence increases when performance improvements can be traced directly to marketing actions rather than correlation or noise in the data.
Experiment-based measurement supports questions such as:
- Did a campaign create additional conversions, or only capture existing demand?
- Did budget increases generate true lift, or just redistribute traffic?
- Did creative changes improve performance in a measurable way?
Analyses
Analyses add another layer of evidence by helping teams interpret trends and plan ahead.
Regression models, forecasting systems, and performance modeling provide context that tracking alone cannot offer.
Analytical methods help teams evaluate scenarios, estimate future return, and identify variables influencing outcomes.
Analytical work is especially valuable when teams need to:
- Predict performance under different spend levels
- Separate seasonal patterns from channel effects
- Estimate long-term value impact across cohorts
Tracking
View this post on Instagram
Tracking metrics remain essential, but they require careful placement in the hierarchy.
Impressions, clicks, CPM, attribution outputs, and platform-level conversion signals help teams optimize campaigns on a tactical level.
Tracking provides fast feedback loops, yet tracking signals are often the noisiest due to attribution bias, platform incentives, and measurement gaps.
Tracking metrics help answer optimization-focused questions like:
- Which ads are driving the lowest CAC this week?
- Which channel is producing the strongest short-term ROAS?
- Where is funnel engagement dropping at the acquisition stage?
Surveys
Surveys sit at the foundation of BEATS because they contribute qualitative insight that numbers cannot fully capture.
Customer sentiment, brand perception, and intent signals often emerge first through direct feedback.
Survey data becomes especially useful when behavioral metrics fail to explain why performance is shifting.
Survey insights can clarify areas such as:
- Brand awareness changes after major campaigns
- Customer motivations behind purchase decisions
- Perception shifts that do not appear in conversion data immediately
The Bottom Line
Clean signals in marketing analytics require purposeful questions, consistent segmentation, goal alignment, anomaly handling, and structured frameworks like BEATS.
Centralized infrastructure and reliable tooling strengthen measurement quality.
Growth teams that apply disciplined analytics practices can make faster decisions, increase confidence, and generate measurable progress in competitive markets.